This page does not contain vaccination numbers, to see this data visit the Vaccination Dashboard under visualisations.
Phase 2 trials for all COVID-19 vaccines show us that they do not prevent transmission or infection however, they may decrease symptoms keeping people out of the hospital and preventing them from dying. They also say that the vaccine may not be as effective against the Beta and Delta variants when compared to the Alpha variant.
I have a few problems with this. Firstly if the vaccine does not protect against the latest most prevalent variants then it does not protect at all as these variants will become the most dominant. The second problem I have is that if it does not stop transmission or infection the virus will still circulate freely and case counting will become pointless. Thirdly if vaccinated people continue to spread the virus then what’s the point of vaccine passports and could these people become the main transmission vector if their symptoms are decreased to a point where they become a new type of asymptomatic spreader and fourthly will these leaky vaccines force the virus to mutate in un-natural ways further increasing the risk of COVID.
None of these questions have been answered and a large scale vaccination roll out has occurred without considering unintended consequences.
Before we look at some of the data we shall look at the risks of vaccination. Reported adverse reactions can be viewed using the MHRA yellow card website. However this can be difficult to navigate and as a result the UK Column has created a tool to view the data more easily. This can be viewed here.
After looking at the yellow card data you can see that deaths caused by the vaccine and adverse reactions are extremely high, in fact they are higher than any vaccine that has ever been delivered to the public. Most vaccines are usually withdrawn after a handful of deaths. Most adverse reactions and vaccine deaths are not reported to the yellow card system as most people are not aware of it and vaccine deaths occurring weeks after vaccination could be put down to other causes such as heart attacks, strokes, blood clots or even short illnesses (These people must think we’re thick).
With this said COVID appears to be a high risk to most people over the age of 70 and some people between the age of 50 and 69. With this in mind I support the role out of the vaccine to the over 70’s and a targeted role out to the 50 – 69 year olds to try and protect these people from COVID. As these people are already elderly we do not need to worry about long term risks. I do not support the role out of the vaccine to the under 50 age groups as these people are not at risk and long term side effects of the vaccine are unknown. This vaccine does not prevent transmission therefore vaccinating the under 50’s will not protect the over 50’s. We can see this when looking at data from the third wave where most people are now fully vaccinated or have natural immunity. However the virus is spreading at a concerning rate breaking the established seasonality characteristic.
We will now look at data comparing year 1 and year 2 of COVID. The years will run from 2nd March to the 1st March as we only started accurate data collection in March of 2020 therefore day 0 will be March 2nd 2020.
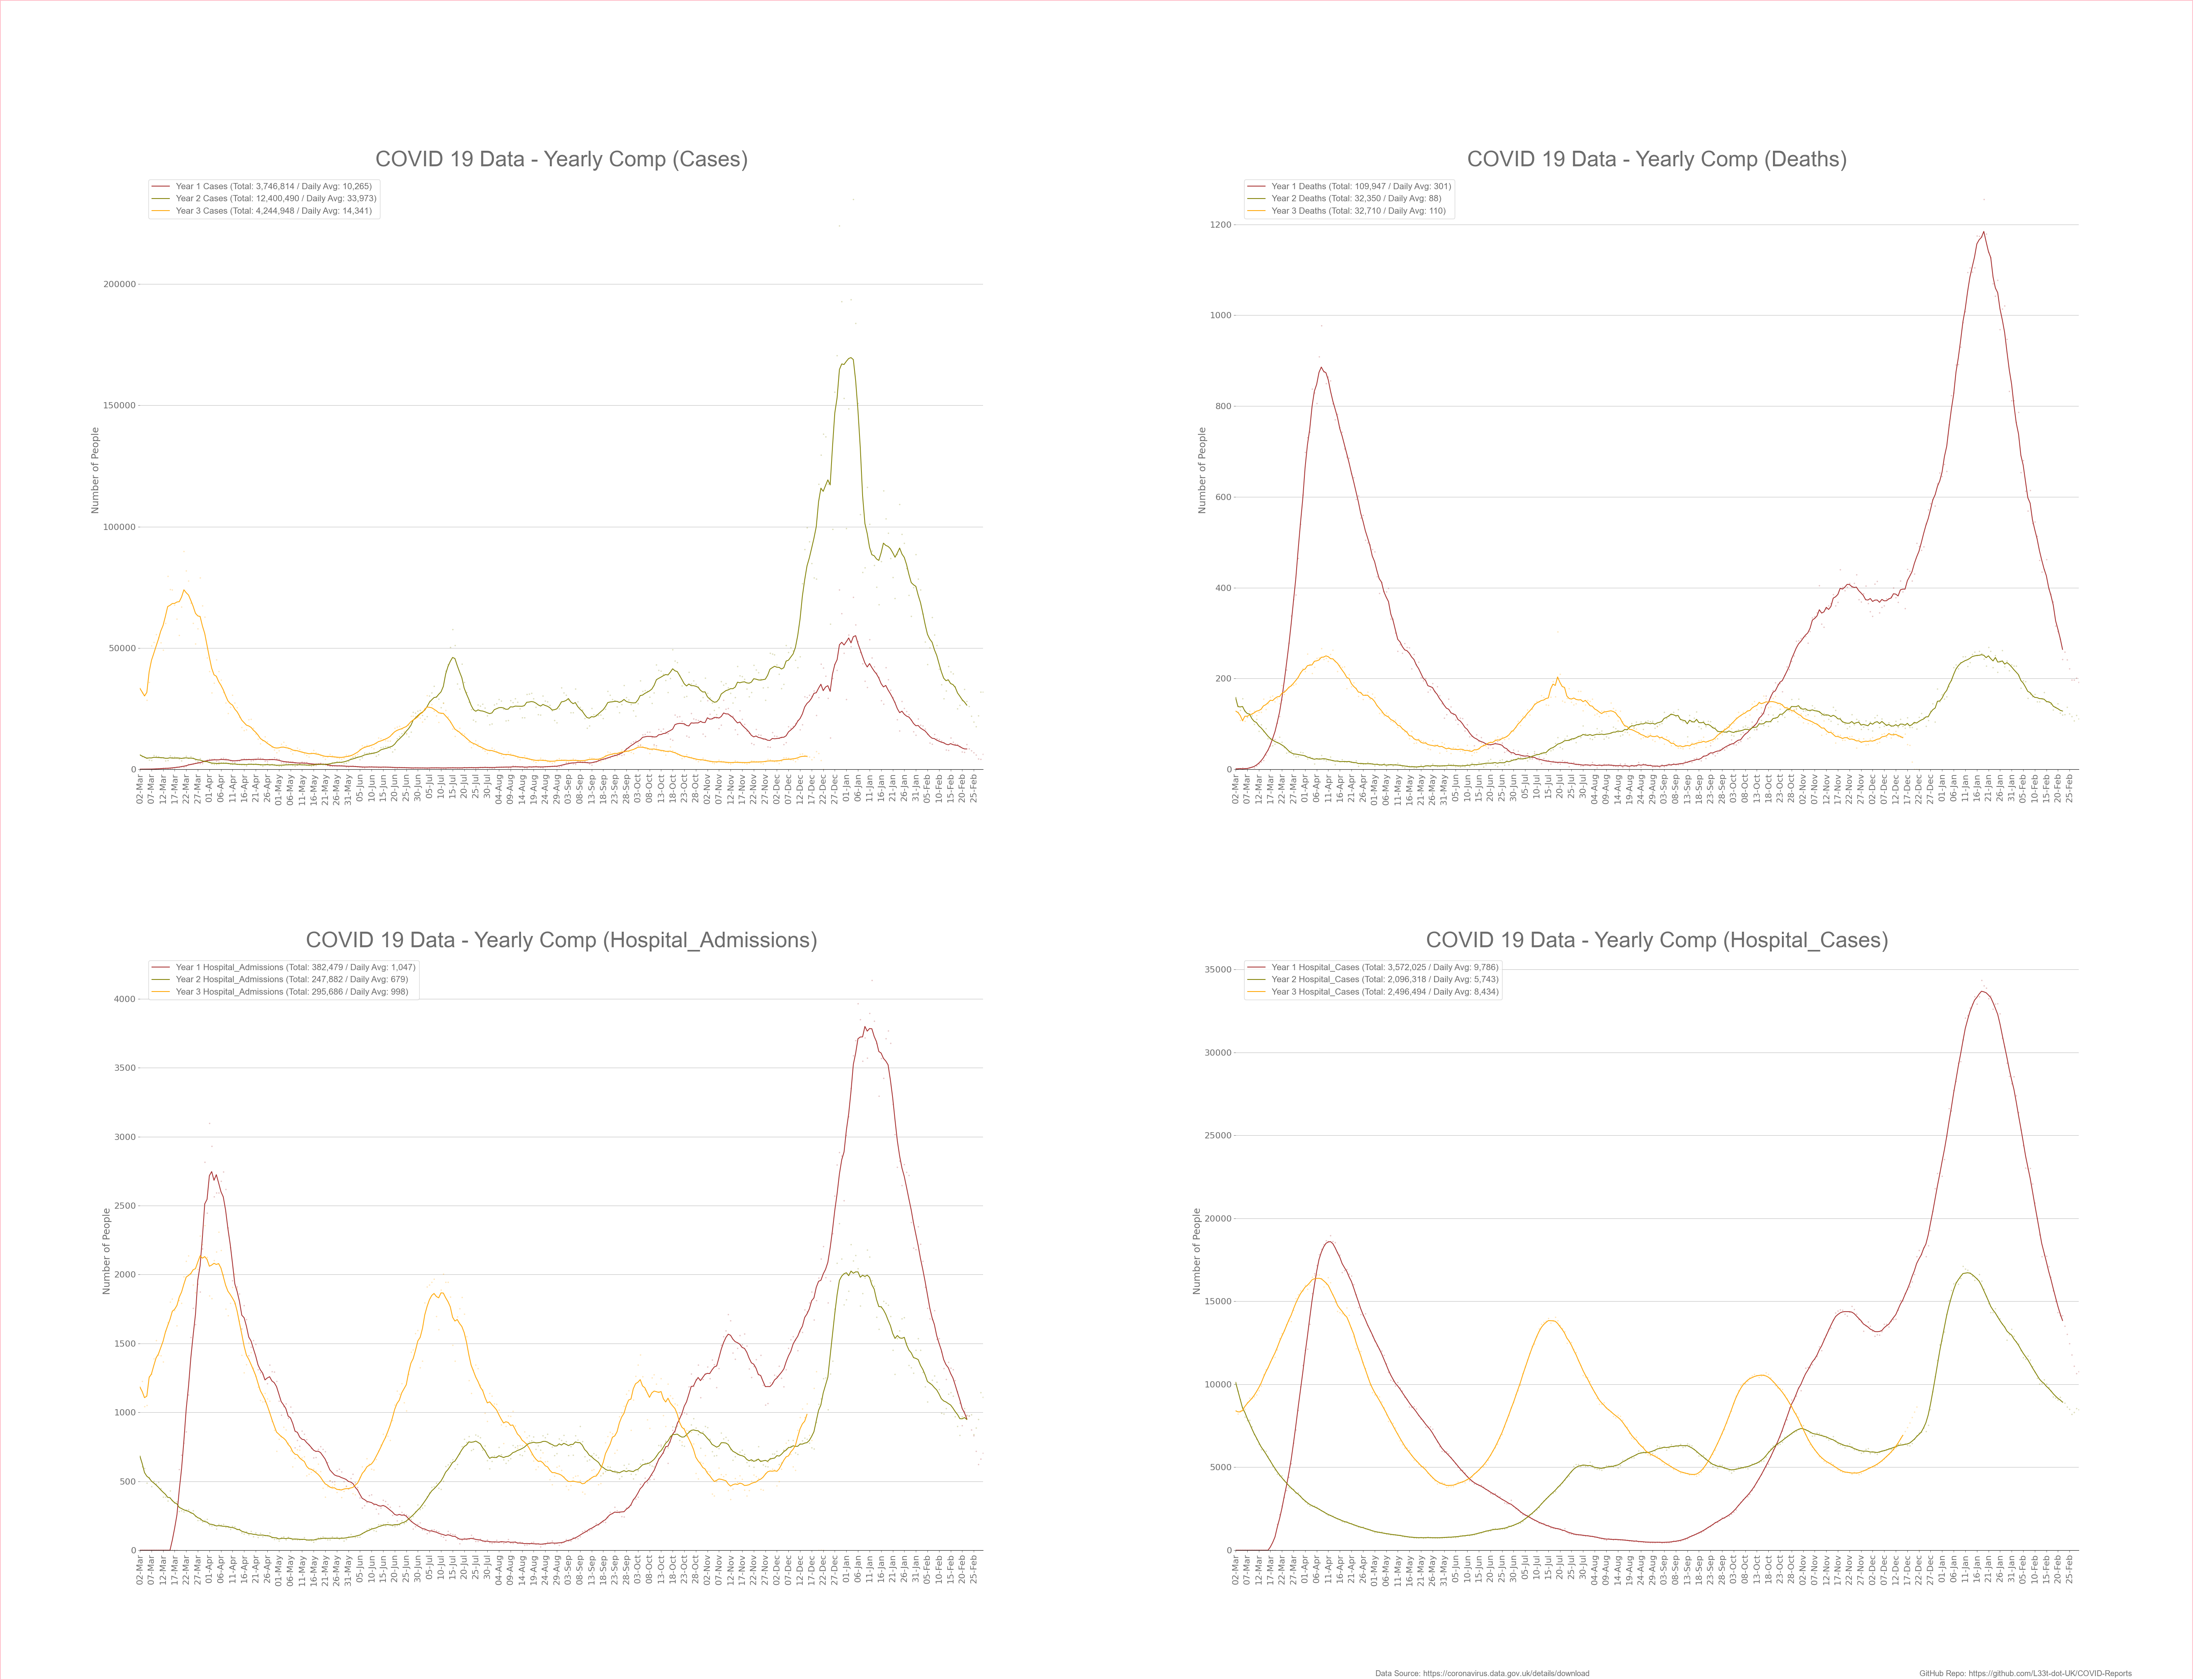
Looking at the above graphs I have compared deaths, cases, hospitalisations and hospital admissions from year 1 to year 2. As you can see it appears that we’re doing better in year 2 than year 1.
Please note that during the first wave we did not have wide spread testing therefore cases in the first wave should be much higher than what’s shown on the graph. With that said we have experienced a large amount of cases during the summer of 2021 which our government puts down to the Delta variant. It is clear to see that after vaccination it the virus is spreading more easily than before.
95% of vulnerable people were vaccinated at the end of March 2021 however, we’re still seeing significant death in these older age ranges. The amount of death in the older age ranges appears to be lower now than before vaccination (see the below graphs). Looking at the above the graphs, the general death rate during the third wave appears to be 5 times less than expected when compared to the amount of cases (This statement was true before omicron). The lower death rate could be for the following reasons; (The below bullet point were written in November 2021 and kept here for transparency)
- The third wave started during the summer when immune systems are stronger.
- Case-demic conditions driven by poor quality PCR tests. Once we control for population the age profile of cases looked very different in the third wave in comparison to the first and second wave raising red flags.
- Vaccine offering a good amount of protection to the very vulnerable. However as we go down the age ranges we see that the vaccine offers no benefits as the lower age ranges are not affected by COVID as shown in previous parts of this website.
- New variants are less deadly than previous variants and potentially more transmissible. This is what usually happens as a virus evolves and would contribute to decreasing morbidity.
We won’t know how effective the vaccines are until we get through winter and look at the data to compare outcomes from both the vaccinated and unvaccinated.
Below the population is broken down into 4 age ranges 0 – 29, 30 – 49, 50 – 69 and 70+ showing cases and deaths for each age range looking at the make up of the third wave to understand why little death has occurred.
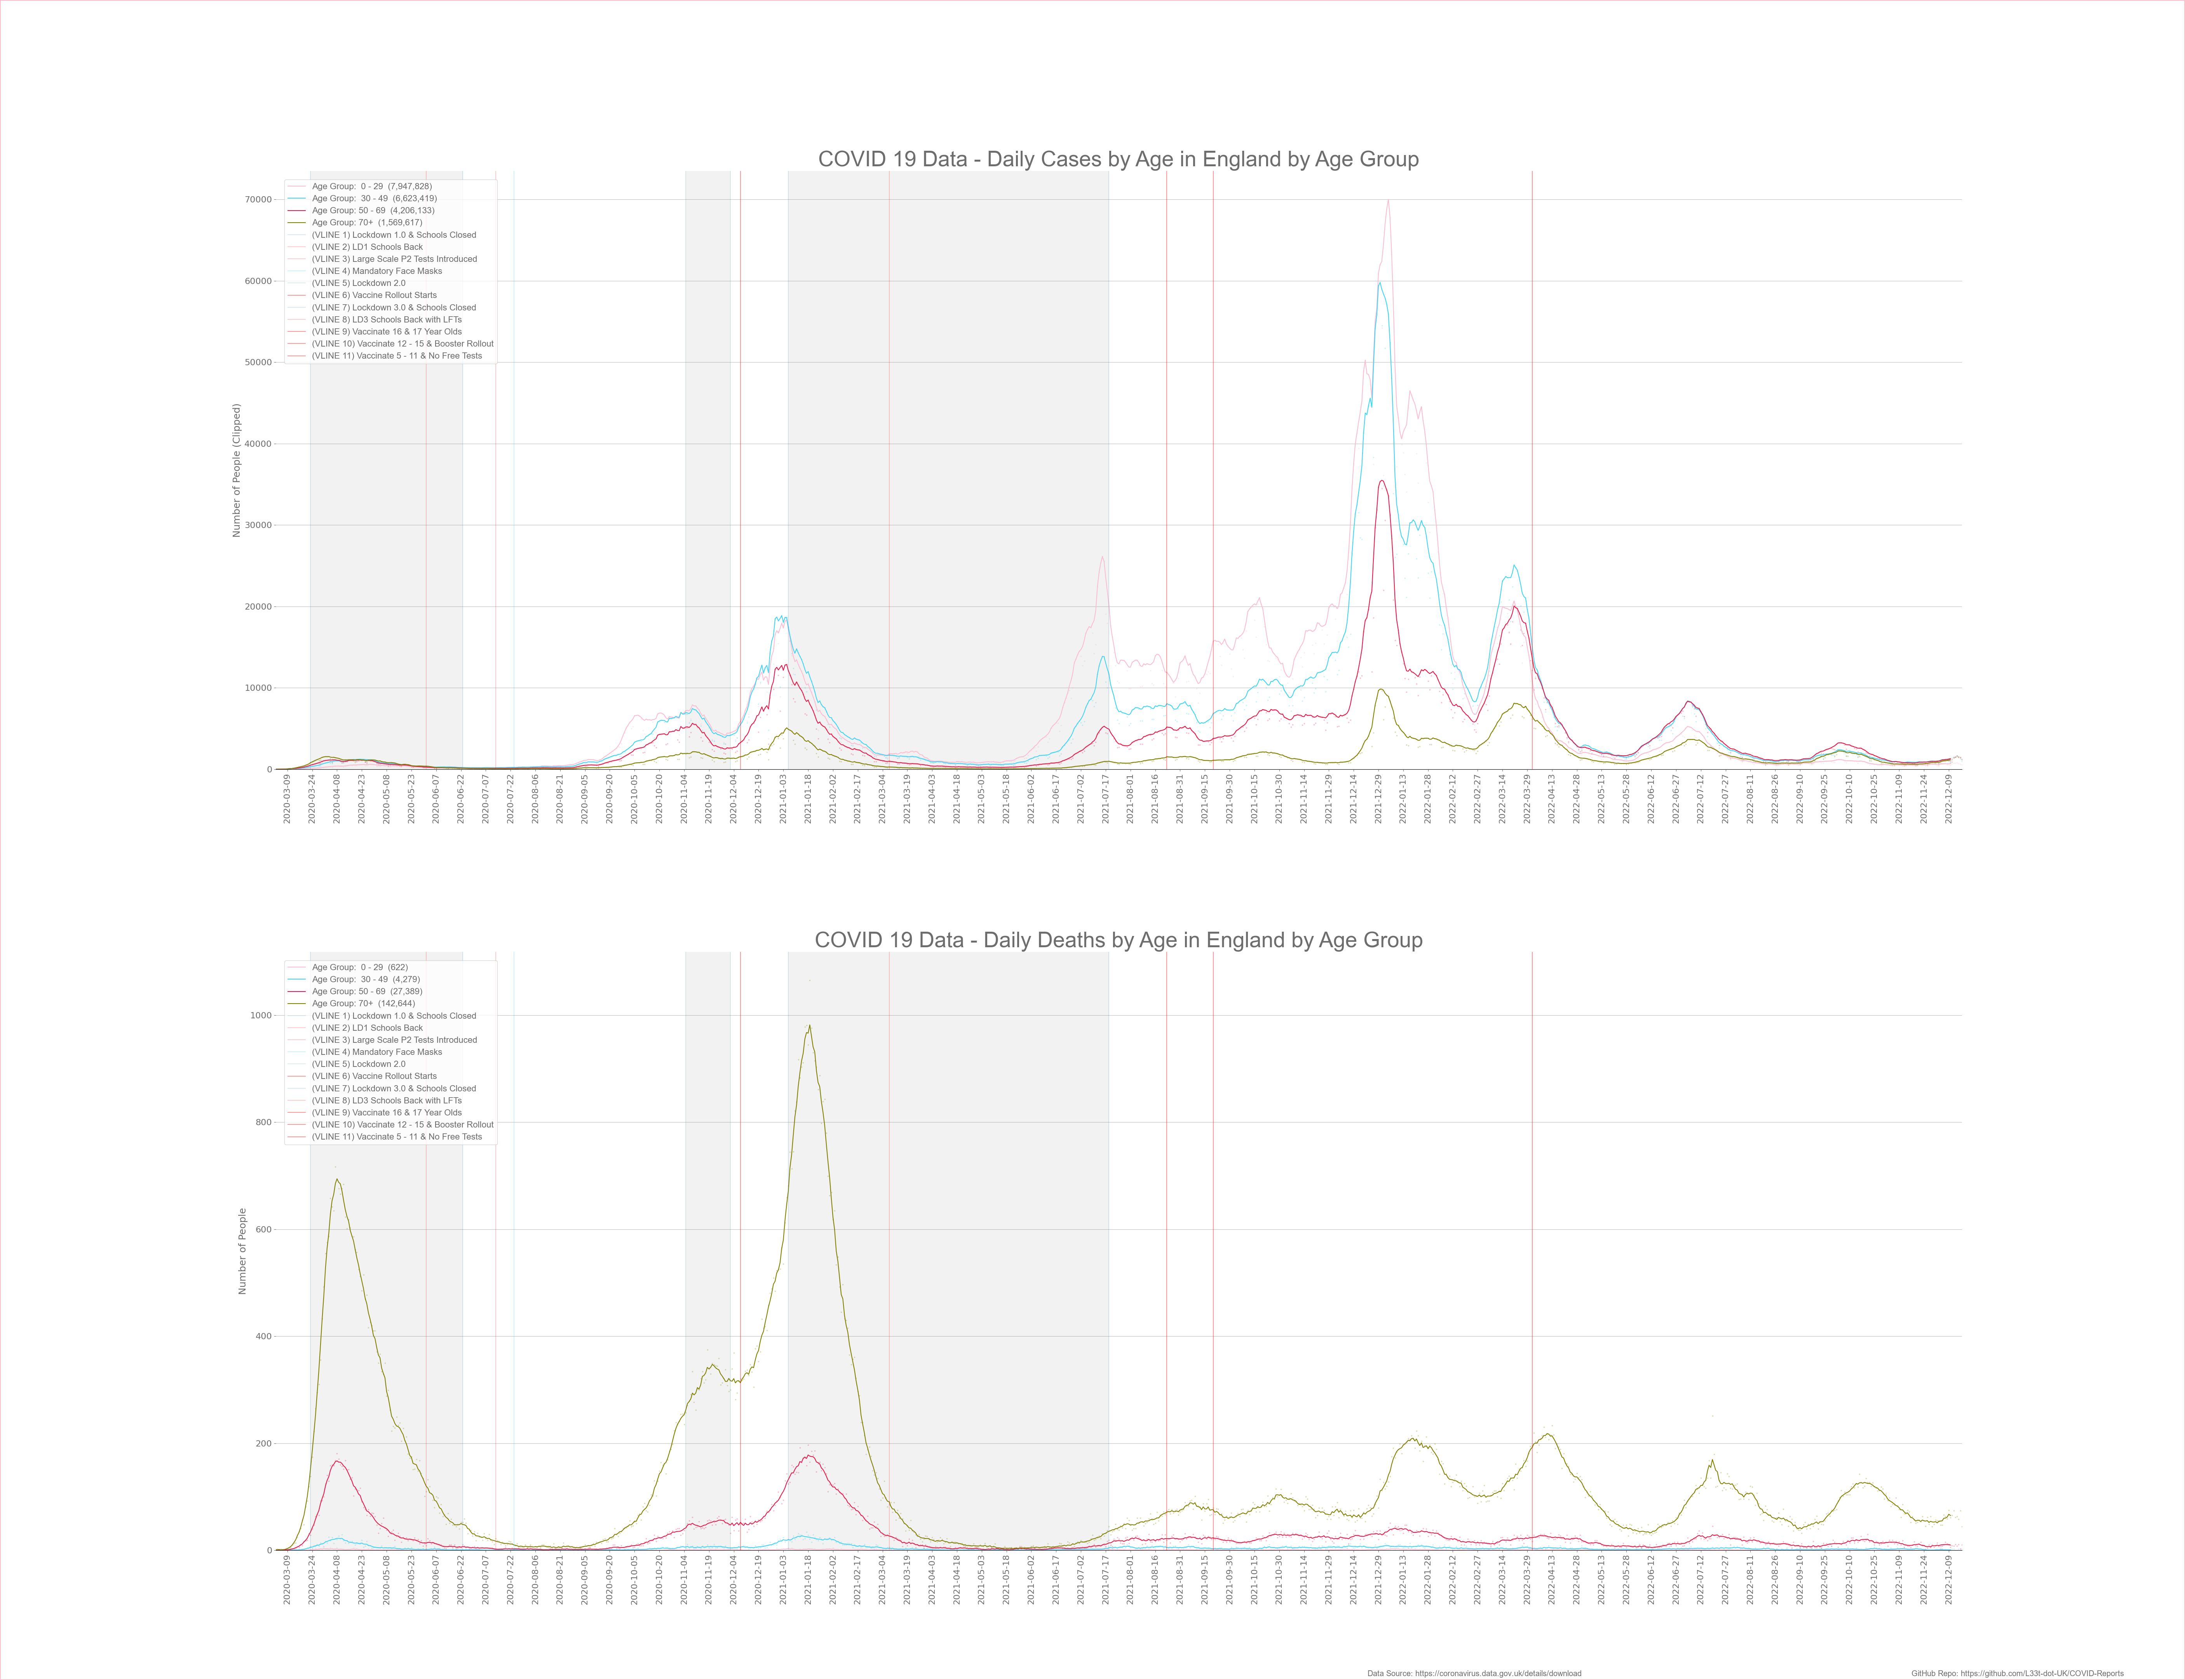
Looking at the above graphs you can clearly see that most cases were in the under 50’s, you can also see that during the third wave death rates for the under 50’s were low similar to the other waves.
When we look at deaths from the over 50’s we can see that these age groups make up most of the deaths and the minority of cases. This highlights the age stratification of this disease.
Case Fatality Ratio (CFR)
To see if the vaccine is having any meaningful effect lets look at the case fatality ratio over time to see if its significantly lower than before vaccination. The below graph split CFR data into 4 age groups where 70+ is the vulnerable group that we need to protect and monitor.

As you can see the CFR has decreased over time, this is to be expected as the population builds up natural immunity, treatments become more effective and new variants become less deadly. Vaccines could have had an affect however we can not prove this as the government will not give death data for vaccinated and unvaccinated on the Government Dashboard. We do have this data in the Vaccine Surveillance Reports however I can’t auto import this data onto my graphs, and they do funky things with the population calculations bringing the quality of the reports into question. When you look at these reports you see that the vast majority of deaths are still in the vaccinated last time I checked it was 84% of death in the vaccinated and 16% in the unvaccinated showing that the vaccines offer very little protection from death for most people. At the moment around 75% of the eligible population have been fully vaccinated.
The CFR figures above use an 18 day lag between cases and deaths, it’s widely recognised that the average time it takes for someone to die after being diagnosed with an infection is between 16 and 19 days. After analysing the data it appears that an 18 day lag gives the clearest results. Please note that when I calculated the CFR I used averaged death and case data to make the curve neater. If I didn’t the curve would be more jagged and harder to interpret. This averaging process has not changed the data just made it smoother and nicer to look at. Age profiled data lags behind by about a week and because the above data is averaged the trend line lags by a further week.
Notice how the CFR has fallen significantly when Omicron became dominant, in fact under Delta and Omicron COVID looks like a totally different disease where transmission has gone through the roof while at the same time the CFR has significantly fallen. Many factors has contributed to this situation and people who choose not to think about the issues may conclude that this is due to the success of the vaccine, however if you look at absolute deaths from COVID the fall is less impressive than what the CFR suggests with a decrease of about 60% in the vulnerable. If we add flu deaths to this data the decrease will be even less. When we look at data from South Africa they have seen the same fall in the death rate even though at the time they only had around 26% of their population vaccinated. This suggests that the decrease in severity is down to natural immunity and mutations rather than the vaccine.
At the same time Omicron has gone wild in Australia, they have around 92% of people vaccinated and the death rate appears to be higher than in other countries. This is significant because they vaccinated but stayed locked down and didn’t expose their population to COVID denying them to build up prior immunity. It appears that our success in decreasing the death rate is because of prior immunity and NOT the vaccine for most of the population. If we followed advice from PHE regarding PCR tests and implemented the Great Barrington Declaration we would have done far better and not destroyed our NHS and economy. We must hold our MP’s to account for what they have done to our country and successive generations through incompetence and corruption.
Conclusion
Looking at the data it appears that the vaccine offers no benefits to the under 50’s however, COVID can be devastating for the over 70’s and with this in mind it could be worth while for these people to get the vaccine. With that said having a vaccine is a medical intervention and it is a decision for the individual weighing up the risks to themselves. If you feel that you are at risk from COVID then you should get the vaccine. Conversely if you feel like you are not at risk from COVID then you should not get the vaccine.
I’m not convinced by the third wave data proving vaccine efficacy as we know the data is noisy and can be manipulated, the decrease in elderly death and corresponding decrease in CFR could be because we went through the summer months rather than because of the vaccine. The third wave data has different characteristics than other waves indicating that something has changed perhaps a more transmissible less deadly variant (Delta/Omicron). I urge people under the age of 50 to think long and hard about receiving the vaccine and to think about if it will benefit you and what the risks are.
If you are a parent please think carefully about getting your child vaccinated, they stand to gain no benefit from it and long term effects of this new type of vaccine are unknown. We must all remember that when the Astra Zenica vaccine was rolled out we were told that it was safe but now we understand that some of the risks make this vaccine inappropriate for the under 40’s. After looking at vaccine data I believe it is only a matter of time until this vaccine is withdrawn together with the other 1st generation vaccines due to safety concerns. They didn’t understand the risks for the AZ vaccine at the start perhaps they don’t understand the risks of the other vaccines now. If your not at risk from COVID why take the risk with a poorly tested vaccine that is still undergoing clinical trials where adverse reactions are extremely high.
As a side note we are now seeing larger than expected numbers of people suffer from heart attacks, strokes and blood clots. On average a sports person is collapsing every 4 days. All of these people are vaccinated and this was not happening before the vaccination program started. These are warning signs that the vaccine is very dangerous, it is my suspicion that the Governments will start to blame these events on long COVID or new variants which is NOT TRUE.
The below video might interest some of you;
![]()
![]()
![]()
![]()
![]()
![]()
![]()