On the 13th September the ONS published a report that compared deaths in the vaccinated and unvaccinated cohorts in the first half of 2021. The conclusion was that 1% of COVID deaths were in the vaccinated and 99% of deaths in the unvaccinated. The media then used this report and concluded that this proves that the vaccine is working.
These are some links to where the MSM has claimed this;
- BBC Report – Covid deaths rare among fully vaccinated – ONS
- Sky News – COVID-19: Fully vaccinated people made up just 1% of coronavirus deaths in England in first half of 2021, figures show
- GB News – Care home staff risk losing jobs if they don’t get Covid jab (First 23 seconds of video)
- NDTV – Fully Vaccinated People Account For Only 1% Of Covid Deaths: UK Data
- Pulse News – ONS: Just 1% of patients who died from Covid this year were fully vaccinated
I could add more links but what would be the point. You can clearly see that MSM are using this study to tell people that the vaccine is working however, when you look at the data that appears not to be true. If this was the case the CFR in the older age ranges would be much less than what it currently is. Below is a graph of the CFR after an 18 day lag between cases and deaths;

The CFR has been decreasing though-out 2021 however, this is mainly due to the changes in testing policy on the 8th March 2021 rather than a meaningful affect induced by the vaccine.
This short article will explain why the media are wrong for saying this and that this report does not prove vaccine efficacy.
The report can be found at the below link;
https://www.ons.gov.uk/peoplepopulationandcommunity/…
I took data from the UK Governments COVID Dashboard and created the below graph that shows how the data has been skewed.
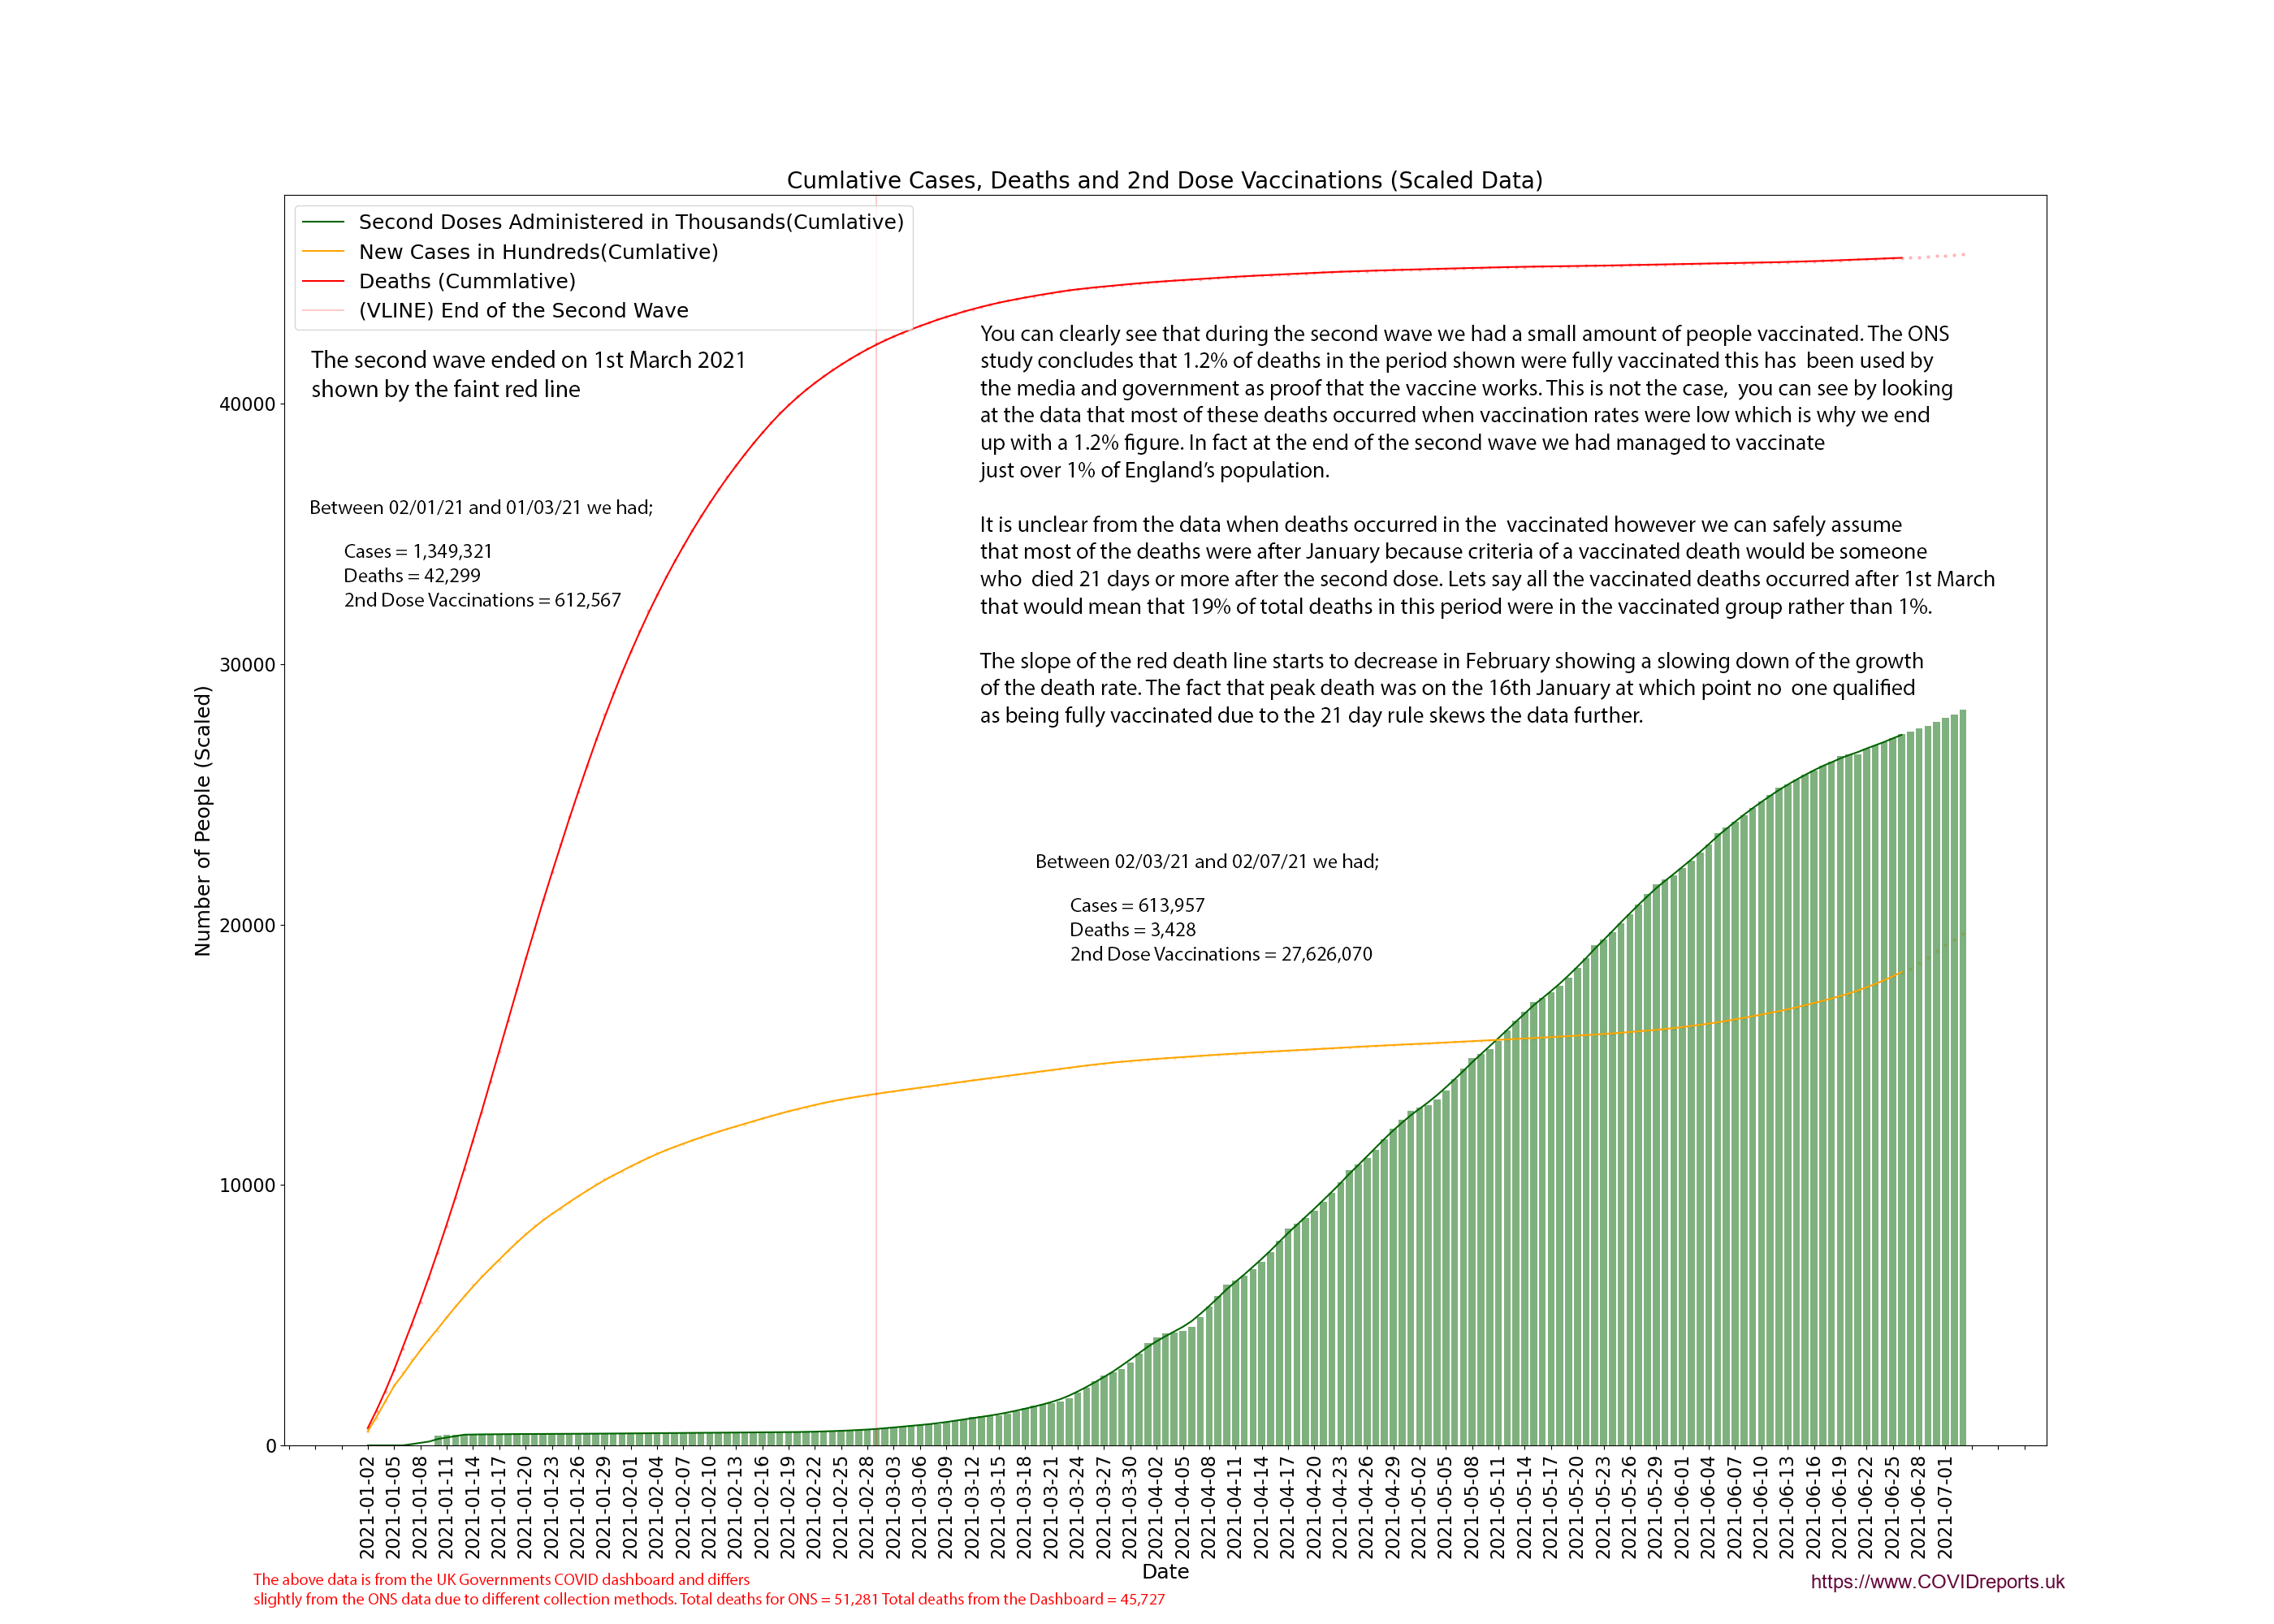
Data Note: Data from the ONS and Government Dashboard differs slightly due to their collection methods. Total deaths in this time period from the ONS is 51,281 and total deaths from the Dashboard is 45,727. I tried to get time series data from the ONS for this but they told me that they did not have the data in that format showing vaccinated vs unvaccinated. Although the data differs slightly the patterns of growth should be the same.
Looking at the above graph you can see that most deaths occurring in the time period happened before 1st March 2021. In fact we had 42,299 deaths in this period and only 3,428 deaths between 1st March and 2nd July 2021. In that same period we managed to vaccinate 28,238,637 people with 2 doses of one of the COVID-19 vaccines.
However we only managed to double vaccinate 612,567 people before the 1st March. This meant that we vaccinated a small number of people during the time that most of the deaths were occurring. When you aggregate the data over time it skews it and makes it look like the vaccinated people were better protected than the unvaccinated. This is untrue and once we look at the data using a time series graph such as the one above you can clearly see the problems with this type of data skew and reporting.
The ONS only counted a fully vaccinated death if the individual had 2 doses and caught COVID 14 days or more after the second dose and death occurs 21 days after the 2nd dose. This means that no one qualified as being fully vaccinated until the end of January where peak death was on 16th January. All of these deaths would have gone down as unvaccinated deaths and this meant that 22,023 deaths occurred before anyone in this time period qualified to be fully vaccinated, that’s 48% of all deaths. If we were to adjust for this we would find that 3% of deaths were from the vaccinated rather than 1%.
If we were to assume that all vaccinated deaths occurred after the 1st March then the vaccinated deaths would account for 19% of total deaths; 640 / 3,428 = 0.186 or 19%, The report concluded that 640 fully vaccinated people died with COVID 21 days or more after the second dose and we had 3,428 deaths between 1st March and 1st July 21. We don’t have the data to show this however lets look at a few scenarios;
If 90% of fully vaccinated deaths occurred after 1st March they would make up 17% of all deaths in this time period.
If 80% of fully vaccinated deaths occurred after 1st March they would make up 15% of all deaths in this time period.
If 70% of fully vaccinated deaths occurred after 1st March they would make up 13% of all deaths in this time period.
If 60% of fully vaccinated deaths occurred after 1st March they would make up 11% of all deaths in this time period.
If 50% of fully vaccinated deaths occurred after 1st March they would make up 9% of all deaths in this time period.
Breakdown of deaths are as follows;
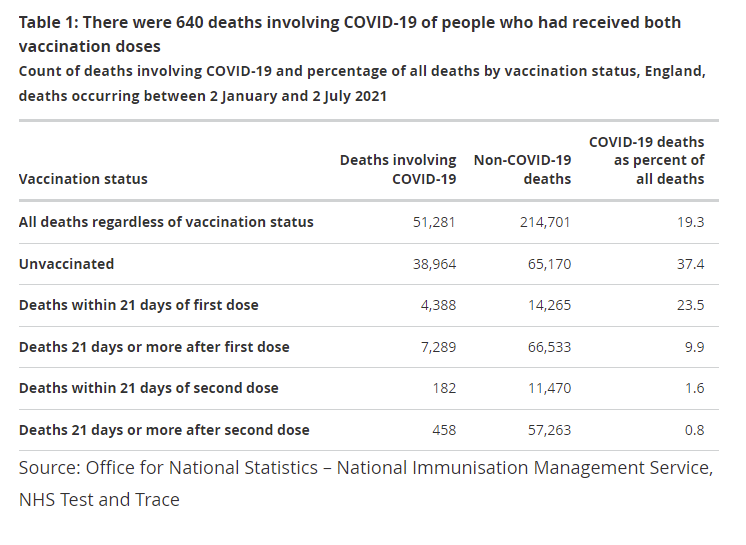
If we reclassify people as being vaccinated after the first vaccine you find that 24% of people who died had at least 1 vaccine. This tells us that the vaccine may not have protected the people it needed to and could have put them at more risk as we know that it will attenuate your immune system for up to 21 days making you more susceptible to any virus. We can see this in the non-COVID deaths for people with at least 1 vaccine where they make up 69% of all non-COVID deaths. This could be as an unintended consequence of the vaccine or it could be because these people were at more risk of death anyway due to old age, etc.
The “COVID deaths as percentage of all deaths” is a disingenuous column as most people died with COVID when only 1% of people were fully vaccinated and for most of the time period COVID death was low where as all cause mortality stayed constant between March and July, see above graph. The highest death day was 16th January by which point no one was classed as fully vaccinated skewing the data further. The above table which is from the report was designed to deliberately mislead people. The rest of the report is full of similar misleading tables.
We can safely assume that most of the deaths from vaccinated people occurred after 1st March because of the 14/21 day lag and the low amount of people vaccinated before this point. When we control for this we can say that between 9% and 19% of people who died in this time period were fully vaccinated and 24% of deaths for the time period included people who had at least one vaccination. The 9 to 19 percent figure appears low considering 28,238,637 people were fully vaccinated by July however, 19% is what we would expect to see if the vaccine had no effect due to the sliding scale of vaccination and lower death rate due to the seasonality characteristic over time. I can go further and say that because 24% of all death occurred in people with at least 1 vaccination that these people were at more risk because most of the death occurred when vaccination rates were low.
Most of the cases in this dataset was before the Delta variant and this report does not inform us about how the vaccines will preform against this variant.
What I can say is that the 1% claim is disingenuous and any media source suggesting that this proves the efficacy of the vaccine should be challenged and reported for spreading FAKE NEWS.
![]()
![]()
![]()
![]()
![]()
![]()
![]()