Data in this article is correct as of Week 38 2021
Article Date 3rd October 2021
We’ve all heard this over the past few months. Even if your not at risk from COVID you should still have the vaccination to protect others. Here’s Humpty Dumpty telling care home staff that if they don’t get vaccinated they shouldn’t work in a care home. I wonder how many years he’s spent working in such settings?
Now this really annoys me because the governments own data does not back up this view point. They release a vaccine surveillance report every week looking at cases, deaths and hospitalisations in the vaccinated and unvaccinated cohorts. You can download them from the below link;
https://www.gov.uk/government/publications/covid-19-vaccine-surveillance-report
I’ve looked at these reports in great detail and have concluded that they are not worth the paper they are written on as the numbers don’t add up when calculating population sizes and the projected lives saved due to the vaccine are way too high. But for this exercise we will assume that these reports are of high quality as they are government reports and everything that Humpty Dumpty says should be backed up by government data!
The below image is a screen shot of week 36, 37 and 38 reports showing cases in the vaccinated and unvaccinated;
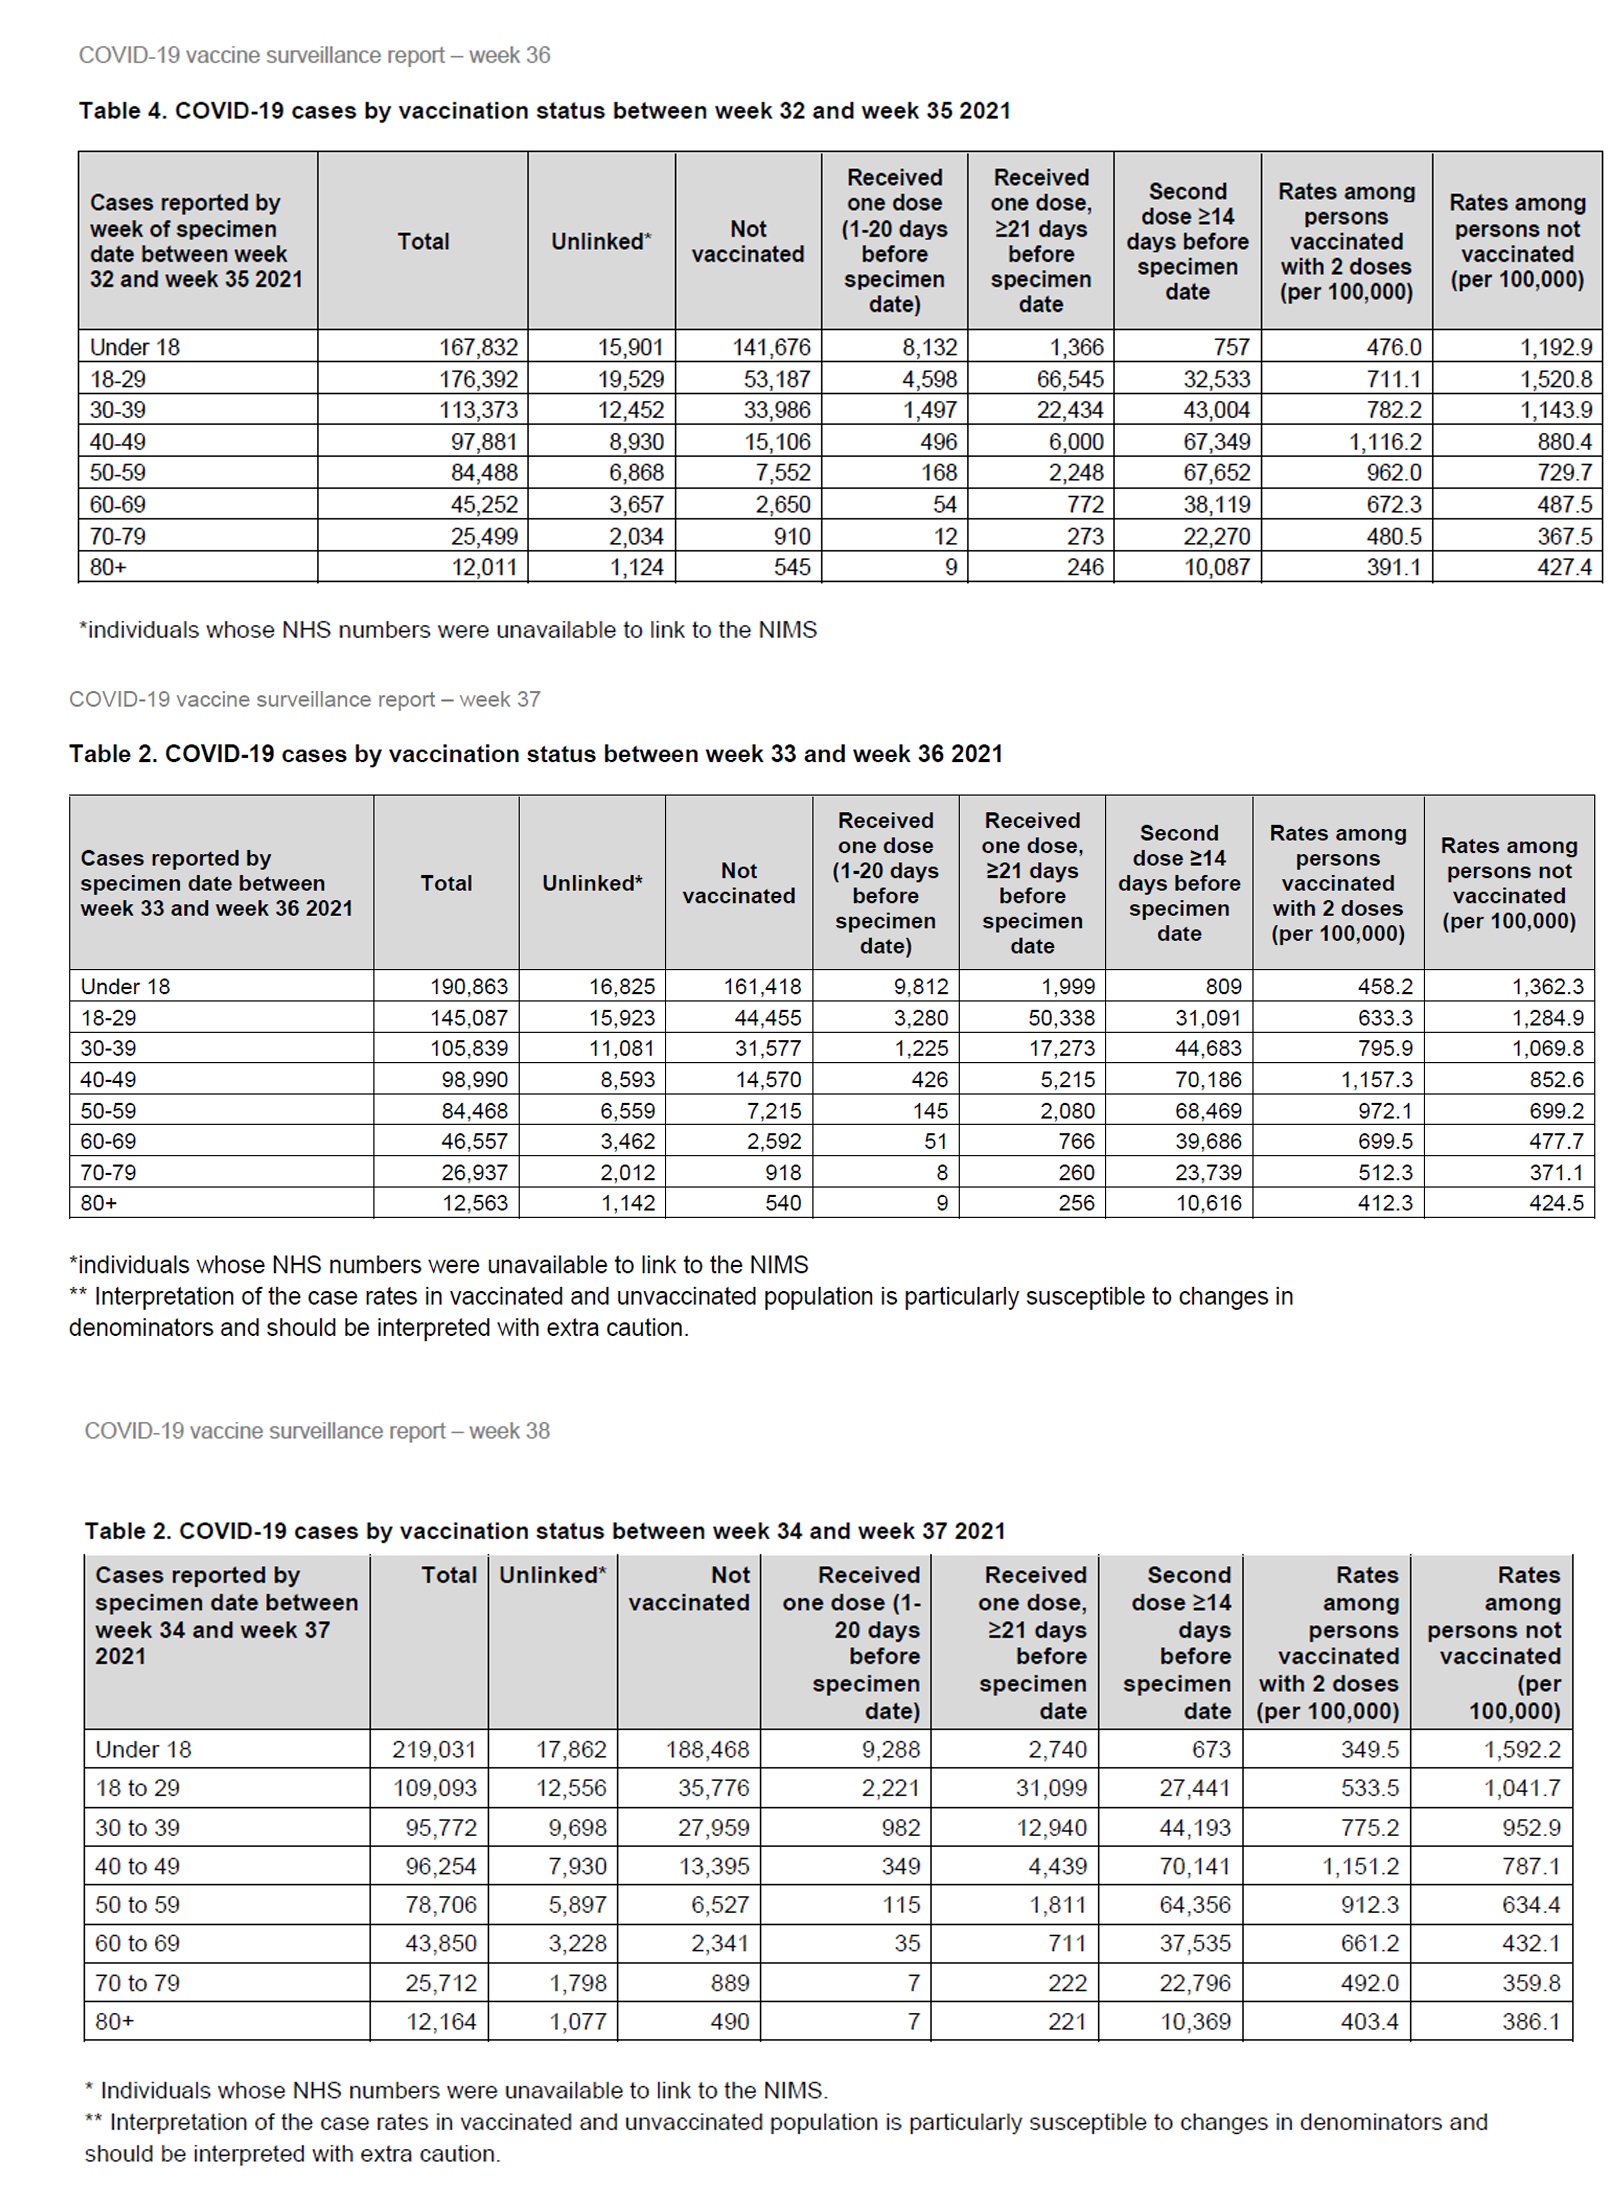
You can clearly see that when we compare cases numbers between the vaccinated and unvaccinated that there is a substantial increase in case numbers for the vaccinated once we get over the age of 30. This is interesting because the majority of people above the age of 30 are vaccinated where as under this age group we find less and less people vaccinated.
You can also look at the last 2 columns that calculates cases per 100,000 people for both the vaccinated and unvaccinated groups. Once we get above the age of 40 prevalence in vaccinated people increases by a substantial amount.
I have used these reports to estimate the ratio of vaccinated to unvaccinated people in each age group as at the time of writing this information is not published by the Government (Please note that the error rates in these calculations are between 3 to 6 percent). These ratios can be seen below;
- Under 18: 1.60% to 98.3%
- 18 to 29: 59.96% to 40.04
- 30 to 39: 66.02% to 33.98%
- 40 to 49: 78.17% to 21.83%
- 50 to 59: 87.27% to 12.73%
- 60 to 69: 91.29% to 8.71%
- 70 to 79: 94.94% to 5.06%
- 80+: 95.29% to 4.71%
As you can see most of the adult population are vaccinated, in accordance with these reports I estimate the rate at 78% for the adult population of England and 62% for the whole population including children. The groups that have the highest rates of vaccinated people also have the highest case numbers per 100,000 population in the vaccinated group with the exception of the 80+ age group. This suggests that the vaccination is not protecting against transmission and in fact if you are above the age of 40 and vaccinated your a greater risk to others than if you were unvaccinated.
The case rate is far higher in the under 30’s age groups this can be explained by excessive testing being carried out in this age group using a flawed test. Most students in secondary school, college and university were carrying out tests bi-weekly which inflated these figures by a huge amount.
As we vaccinate more people in each age group we see that rates of COVID in the vaccinated increases and once we vaccinate more than 70% of any age group we then see more COVID in the vaccinated portion of the age group with the exception of the 80+ age group, these people tend to be less mobile which could explain this.
We would expect to see the opposite where prevalence rates should be less in the vaccinated. If we were to compare hospitalisations and deaths from the same reports we would see the opposite, where it looks like unvaccinated are at greater risk of hospitalisation and death but less risk of catching the virus. This increased risk is in accordance with the reports per 100,000 calculation.
If you look at the raw numbers we see that 58% of people in hospitals are vaccinated and 75% of deaths are also vaccinated. This goes against mainstream media reports of the unvaccinated filling up hospitals.
75% of deaths are in the vaccinated group, this roughly coincides with the amount of people who are vaccinated in the adult population.
If we look at the vulnerable group, 70’s and over we see that 87% of the deaths are from vaccinated people. This age group has a vaccination rate of around 95% which suggests that the vaccine may have a small effect however the difference is so small I would suggest that it is having little to no effect and the difference can be due to errors within the data. If these vaccines were 95% effective we would expect to see less deaths in the vaccinated group when compared to the unvaccinated group. We see these patterns in other countries such as Israel and Iceland however the reality of vaccine effectiveness is hidden in the reports as the per 100,000 figures suggests that your at more risk if your unvaccinated.
The Mis-Classification problem
A vaccinated death is an individual who dies 21 days or more after their second or booster vaccine. A vaccinated case is where some one has a positive COVID test 14 days or more after the second dose or 14 days after a booster. You are not considered vaccinated until you have had your second dose and the time lag previously mentioned has been met.
This give us a huge problem where people who are newly vaccinated or have only had one vaccine are classed as unvaccinated. The justification for this is that the vaccine only works properly after at least 2 doses and it overstimulates your immune system for up to 3 weeks resulting in the recipient becoming more susceptible to catching any virus including COVID.
This means that many cases and deaths from people who are vaccinated but do not meet the criteria laid out above are classed as unvaccinated. If we were to reclassify the data and count everyone who has had at least 1 vaccination as vaccinated we would find that over 95% of deaths and cases are in the vaccinated. initial studies looking at COIVD deaths and excess death has found that death spikes occurred in different age groups around the time of vaccination meaning that the vaccine could have contributed to more cases and deaths than expected both COVID and non COVID. This has been missed due what we call a vaccinated case/death. This data fraud has skewed the data in ways that only serve one purpose and it’s nothing to do with public health.
Conclusion
These reports inform us that vaccinated people above the age of 39 are catching and spreading COVID at a greater rate than unvaccinated people of this age group. They also inform us that unvaccinated people are at a greater risk of death and hospitalisation from COVID (if you believe the per 100,000 calculations) therefore the argument made by the government that we must all get vaccinated to protect Granny does not hold up and in fact we can now say that the vaccinated pose a greater risk to the unvaccinated as it appears from these reports that the unvaccinated are ending up in hospital and dying at a greater rate while the vaccinated are spreading COVID.
Case rates in the under 30’s age group are very high this can be explained by the mass screening in educational settings skewing the data. Death data for this age group is so small we can not use it to come to a meaningful conclusion although Humpty Dumpty might say something different.
We see no evidence that vaccination limits spread and protects other people in fact the data shows the opposite, if the vaccine enables transmission then it could result in more deaths due to a higher baseline in cases especially during the winter months. Since vaccination we have seen COVID behave differently with high levels of cases and low levels of death. When Humpty Dumpty tells us that we must get vaccinated to protect others we must call it out as FAKE NEWS.
If the government insists on dividing people by vaccination status the unvaccinated must demand protection from the vaccinated in the way that non-smokers refused to be around second hand smoke a couple of decades ago. It is unfair to put others at risk due to your own silly, uninformed decisions. I don’t believe in segregating people and vaccination is a personal decision that is no one else’s business but your own however, when the government attacks us for not having a dangerous medical procedure that we and others around us will not benefit from we must fight back and use their own data against them.
Beyond this article we have lots of examples where vaccine passports have done nothing for transmission. Look at all of those festivals at the end of August 2021 where vaccine passports were trialled and people still caught COVID.
An example of how out of touch these reports are is that the week 38 report estimated total lives saved by the vaccine at 123,100. We had 109,428 in the first year of COVID from 1st March 2020 to 1st March 2021 in England. Now PHE expects us to believe that between January 2021 and September 2021 (9 months) the vaccine program has saved 123,100 lives meaning that they expected more death this year than last year. The governments Variant of concern report details that the Delta variant which is now dominant is less deadly than the Alpha variant. They can’t have it both ways where they expected more death with a less deadly variant of COVID. Utter rubbish and the government should be ashamed of themselves for publishing such rubbish. They will do anything to make the vaccine appear to be working when we all know that the current data does not prove this and we wont know until after the winter either way.
![]()
![]()
![]()
![]()
![]()
![]()
![]()